


23rd June 2025 - Chart of the Day, Premarket Video & AM Charts

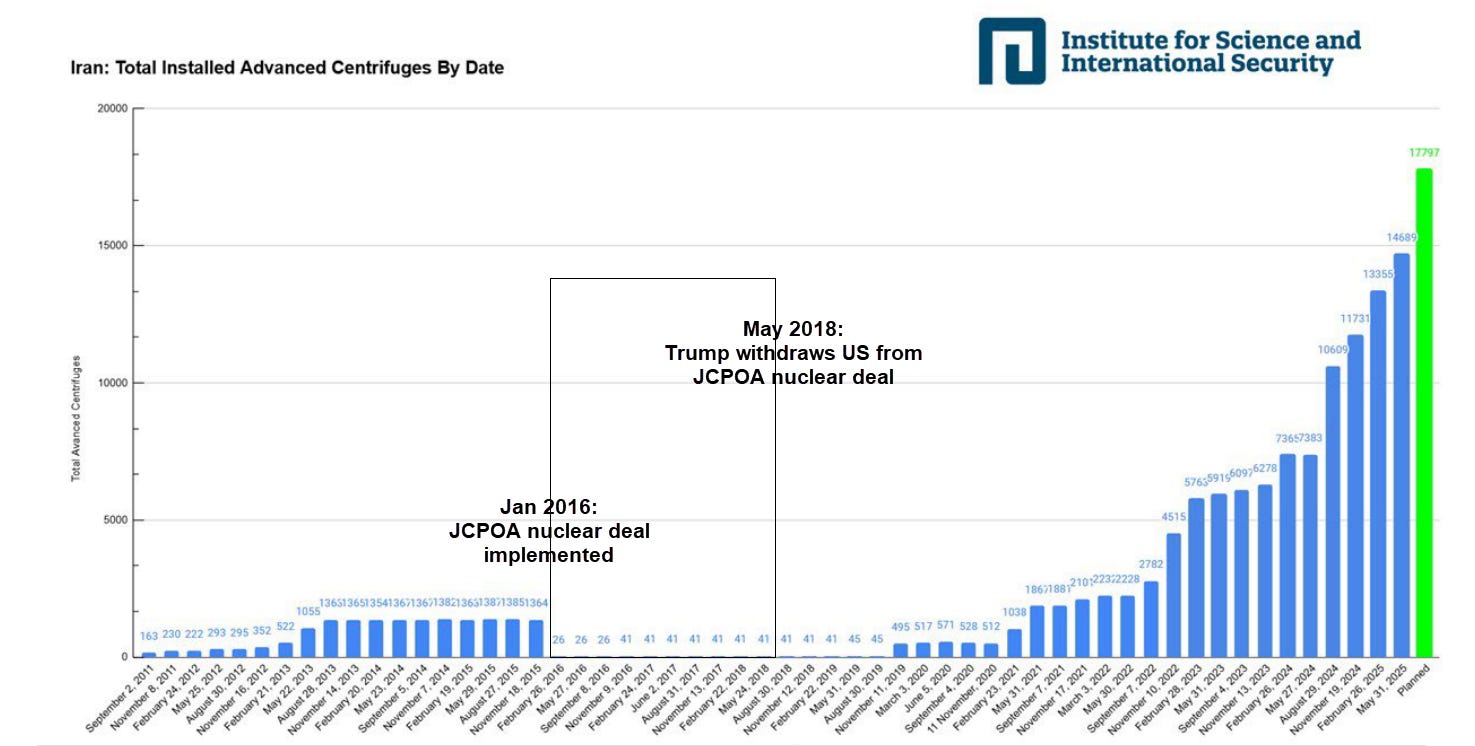
Today’s Chart of the Day is from the Institute for Science and International Security and is a view of the Iranian nuclear enrichment program since 2011.
This is the daily email for paid subscribers that I publish before the RTH open with my premarket video and the 35x hourly futures and currency charts that I cover on a daily basis. I cover the longer term charts on all of these on my The Bigger Picture substack. I cover Crypto on my Crypto Substack. These futures and currency charts are as follows:
US equity indices: - ES, NQ, RTY & YM
Foreign equity indices: - DAX & ESTX50
Currencies:- DX, EURUSD, GBPUSD, USDJPY, USDCAD, AUDUSD, NZDUSD
Bonds:- ZB, ZN
Energies:- CL, HO, RBOB & NG
Metals:- GC, SI, PA, PL & HG
Soft Commodities:- KC, SB, CC, CT & LBR
Grains:- ZW, ZC, ZS & ZL
Meats:- LE & HE
Premarket video:
Keep reading with a 7-day free trial
Subscribe to Charting The Markets Substack to keep reading this post and get 7 days of free access to the full post archives.