


Assessing This Bear Flag Inflection Point

In my post on 17th April I posted some 15min charts with arrows showing an ideal path to forming bear flag wedges on SPX, QQQ and DIA. I added one for IWM in the post after that. I’ve updated these since but left the original arrows where I first drew them for reference on the last four charts today so you can see I wasn’t that far off.
In my post on Tuesday 29th April I was saying that ideally we would see a modest decline (by recent standards) to play out some negative divergence on SPX, QQQ, ES and NQ and we saw that play out over the next few days with all the hourly and 15min sell signals I mentioned in that post reaching target. After that I was looking for another and probably last leg up within those bear flags and since then we have seen new rally highs on all four.
In my last post on Thursday 1st May I was looking for more upside with a likely high early this week, and that hasn’t quite delivered, though I think there is a good case for seeing my target area hit today or tomorrow.
In my premarket video on Monday 5th May I was looking for a decline that lasted a couple of days and then retests of the rally highs to set possible daily RSI 5 sell signals brewing across the board on the US indices I cover, SPX, QQQ, DIA and IWM, and in my premarket video this morning, after that decline delivered, I was looking for a retest of the rally highs across the board on these today or tomorrow, and at the time of writing that looks very likely to happen today.
So how are the ideal bear flag setups that I drew and posted on 17th April on SPX, QQQ and DIA looking now? Bottom line the rally has gone higher and lasted longer than I expected then, but the overall setup still looks decent.
I think the most important of these four charts is likely to be SPX, though I might be mistaken, so I’m still expecting the ideal flag resistance trendline that I drew on 17th April to be hit. That trendline is currently in the 5760 area, so SPX would need to go up another 60 handles over the rally high so far.
SPX 15min chart:

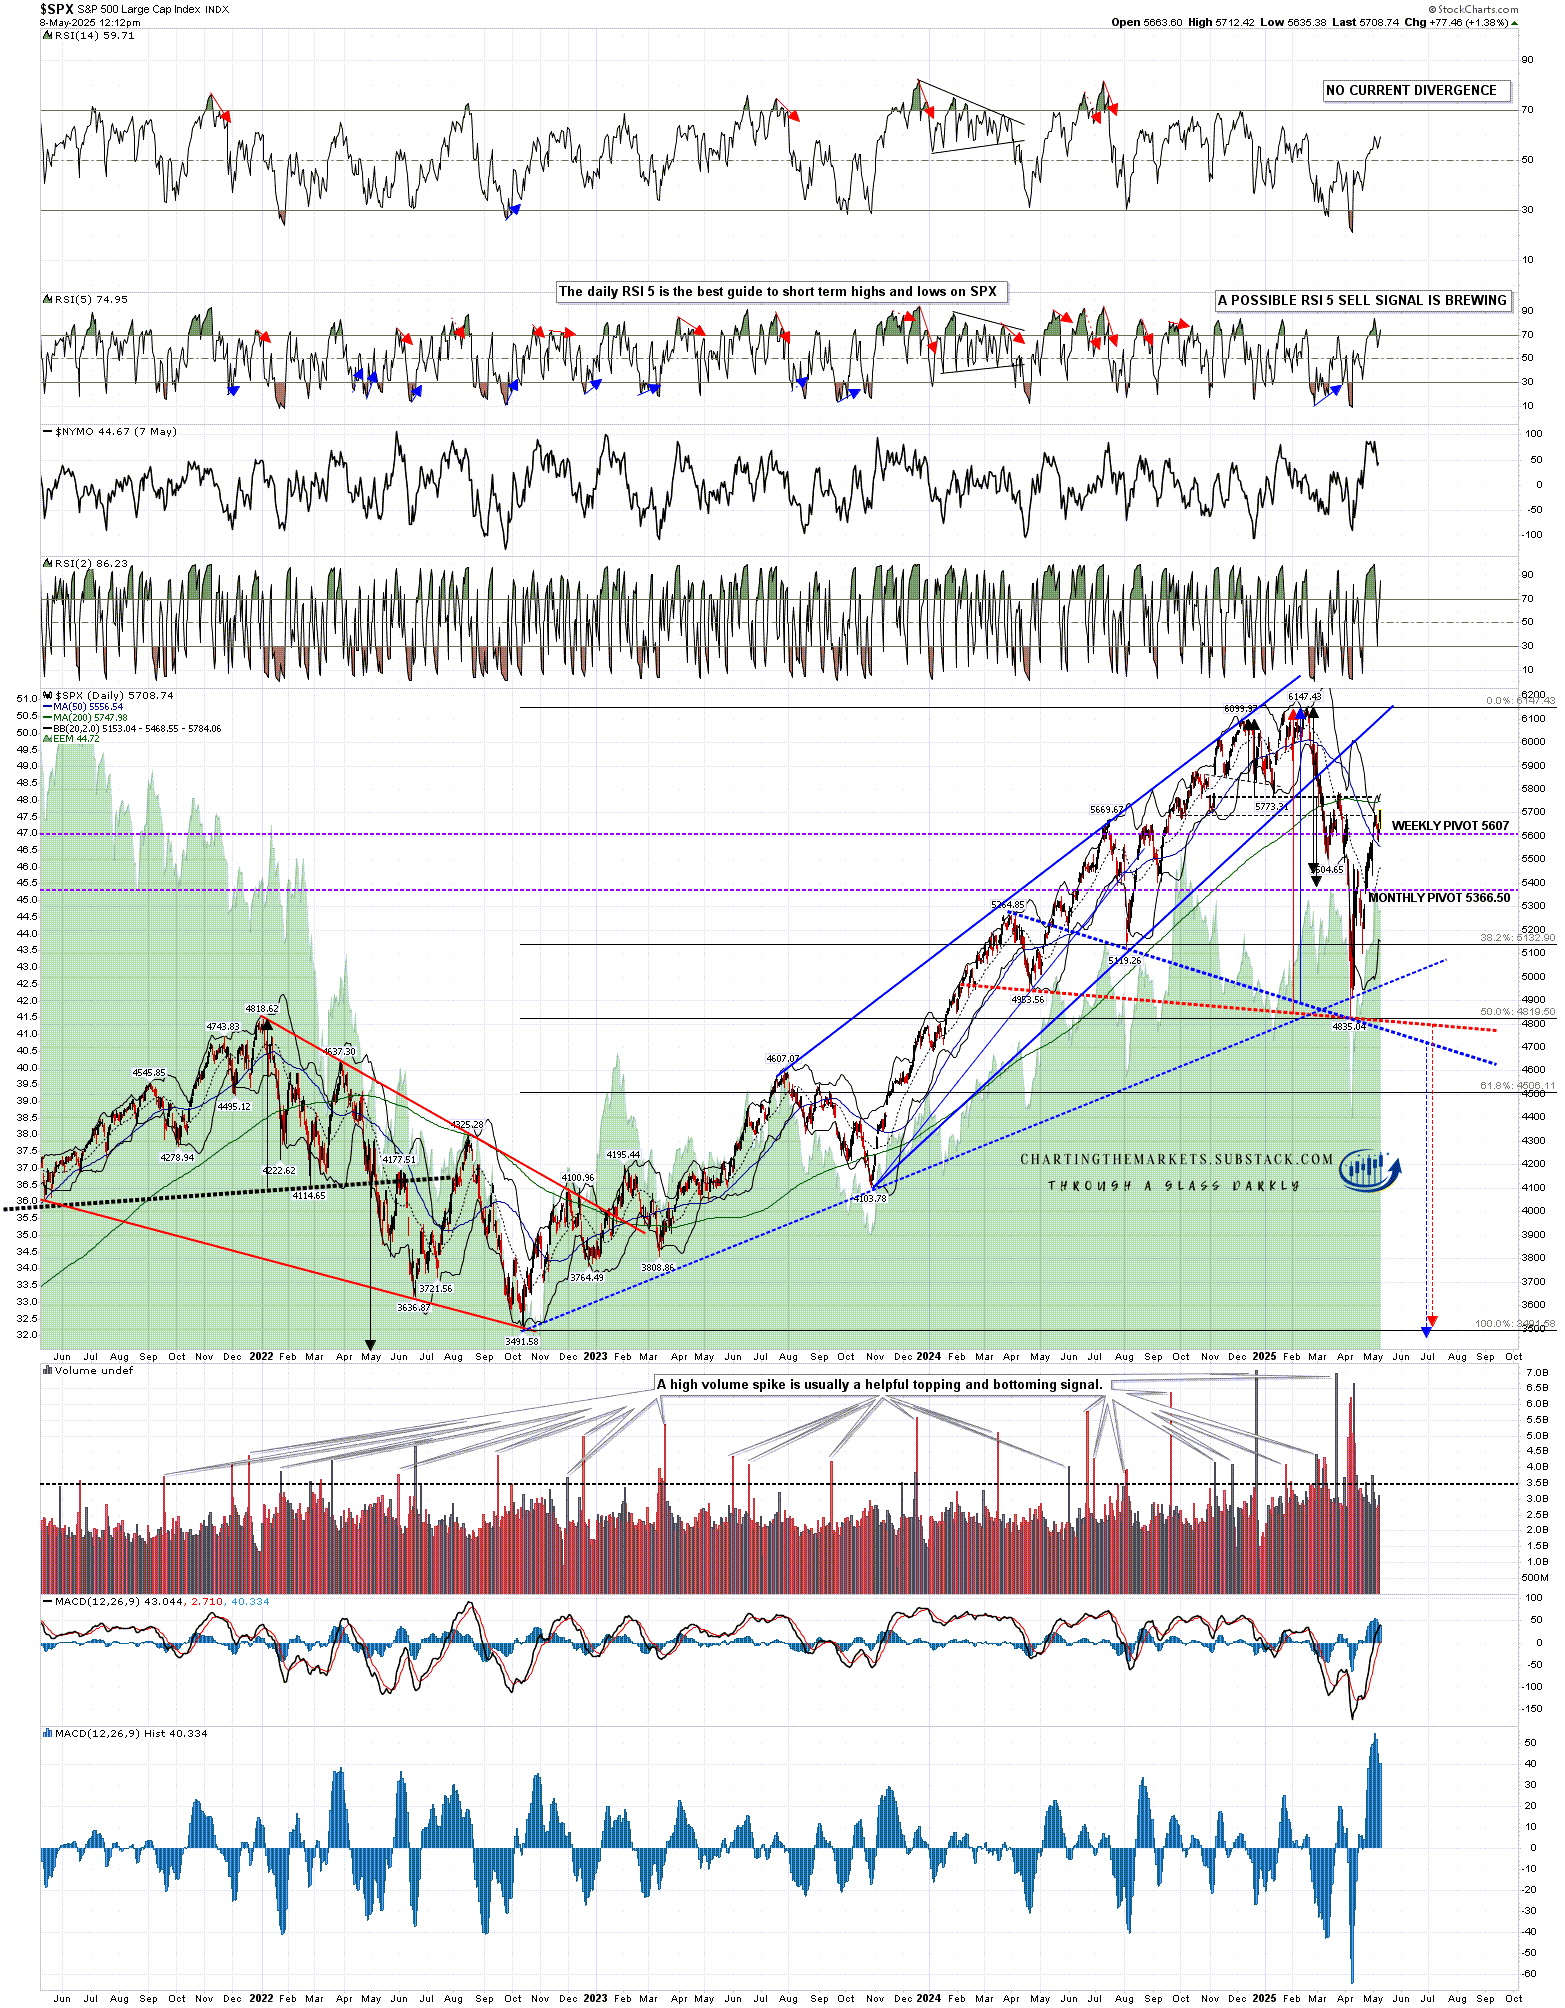
That might seem a little ambitious, but it is also a decent match with the last major resistance level left on SPX, which is of course the 200dma, currently in the 5748 area. A break and conversion of the 200dma would open a possible retest of the all time highs, which I think is unlikely directly from here but is still a significant possibility worth considering if we exit this inflection point to the upside.
SPX daily chart:

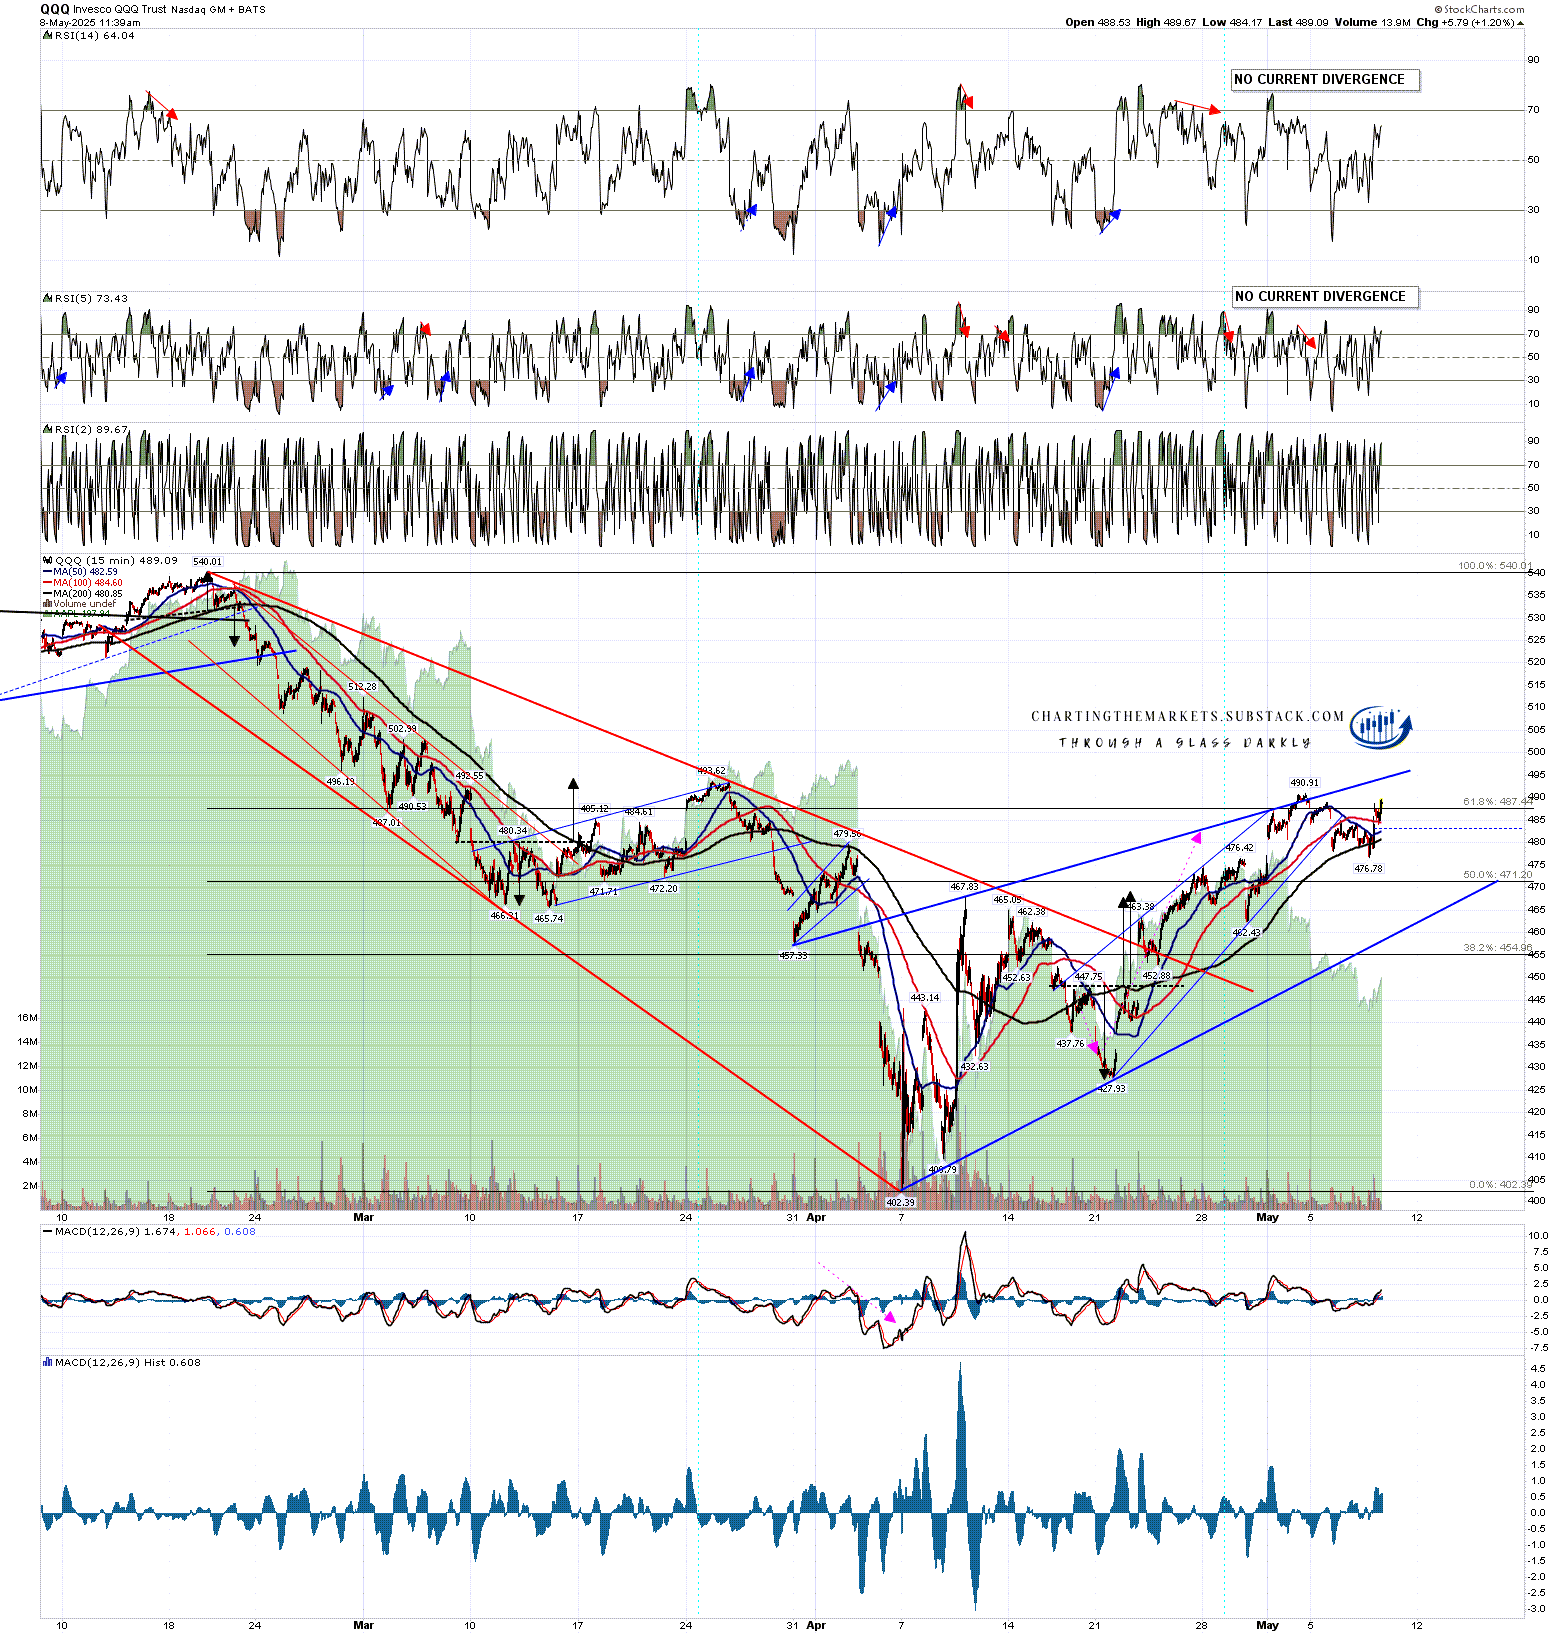
On the QQQ chart the ideal flag resistance trendline was hit last week and broken slightly at the current rally high. That might hold as resistance and, if so, then SPX likely won’t reach the 200dma. We’ll see.
QQQ 15min chart:
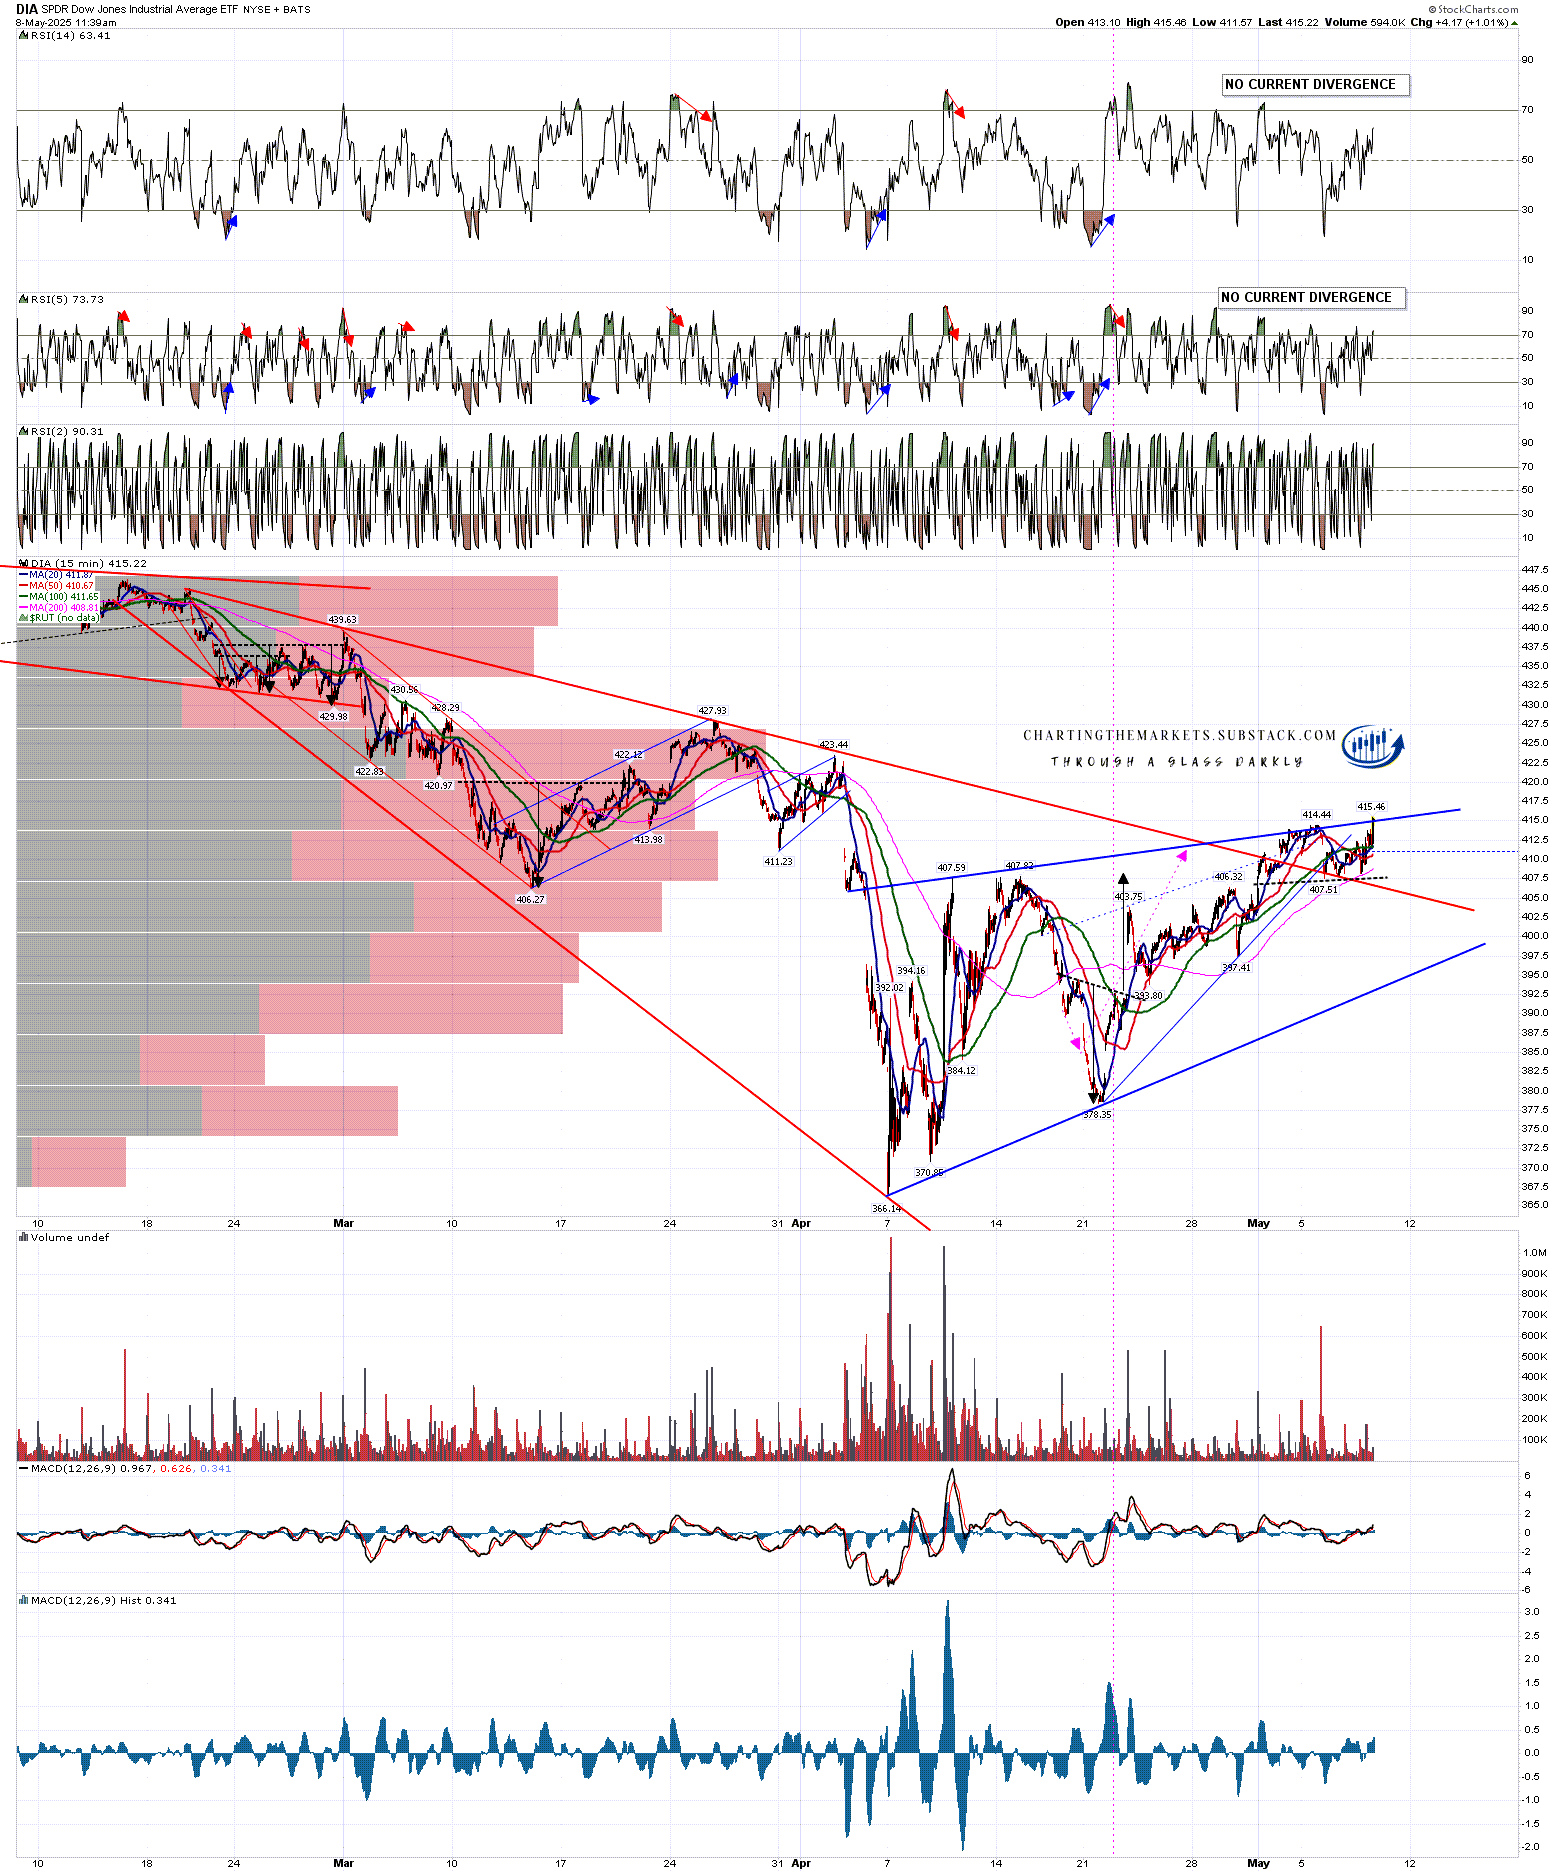
DIA also reached the ideal trendline I drew on 17th April last week and the same applies as on QQQ.
DIA 15min chart:
I drew in the ideal bear flag wedge resistance trendline on IWM shortly after the others but that trendline, like the one on SPX, has not yet been reached. That’s now a whisker under 206 and if SPX reaches the 200dma then I’ll be expecting this to be hit too.
IWM 15min chart:

Are these actually bear flags forming? I don’t see much reason to think not as not much in terms of the overall economic and political background has changed during the course of this rally. I think that the delayed tariffs will likely never be reimposed but the White House is still very keen on tariffs, and the tariffs already imposed, with the ongoing trade war with China, still constitute a huge tax rise for ordinary Americans, a serious inflationary risk and a major economic shock.
Growth in 2025 QI was negative (subject to revisions) and if current policy remains on track then I think growth in Q2 will likely be a lot worse, and growth in Q3 and Q4 may well be significantly negative too. Stock markets don’t tend to perform well in recessions. If the whole tariff policy was to be reversed tomorrow I think the shock and uncertainty of recent months would still likely follow through into at least another quarter of significantly negative growth. Unless the 2025 Q1 GDP numbers are revised into positive territory, the odds that the US is now in recession are at least 90% in my opinion.
Could we still see all time high retests before we see lower lows in 2025? Yes, SPX really likes high retests and those high retests could set up some very nice double tops, but I think at least a significant retracement from this area is very likely, and that would likely into lower lows for 2025.
I posted a big H&S scenario on a SPX weekly chart in my post on Tuesday 1st April on my bigger picture substack. I was first looking for a large decline into the 5100 area to reach a possible H&S neckline and then a strong multi-week rally to form a right shoulder on that H&S. That first decline went lower than 5100 but the H&S scenario still looked good and this rally since then may well have been forming that large H&S right shoulder. An updated version of that scenario is on the daily chart below.
Since I started writing this post new rally highs have been made on SPX, QQQ, DIA and IWM so possible daily RSI 5 sell signals are now brewing across the board. This puts us firmly into the inflection point and if US markets reverse hard then the scenario below is on the table here. There are two H&S neckline options show now, but in terms of targets they would both be looking for a retest of the Oct 2022 low at 3491.58.
Do I think that target could be on the table in current months? Yes, though I would note that if and when that H&S should break down there would be another opportunity then to retest the all time high, as the H&S might break down and then fail, which would trigger a target back at the all time high.
SPX daily chart - bear market projection:
In the short term I am leaning 70% towards at least a strong retracement here and 40% towards a retest of the 2025 low in the next three to four months. That may be hard to imagine here, but that is the essence of recency bias. Just before this rally started recency bias had many people leaning short, and after five weeks of a strong rally recency bias has many people leaning long.
If recency bias was useful in real life though then selling low and buying high would often be a profitable strategy. It isn’t, and recency bias just clouds the judgement. Very little has fundamentally changed during this rally and both growth and inflation numbers have got worse, with more of the same expected. The economic outlook for the rest of 2025 looks grim. That is objectively not a bullish backdrop for equities.
I’m doing a series of (currently four) posts at the moment on my The Bigger Picture substack on the US Dollar, US Treasuries, and the reasons to be very concerned about the possible further sharp declines on both that may be coming this year. The first of these posts is looking at the potentially bearish setup on the US Dollar, the second is looking at the potentially very bearish setup on US Treasuries, the third is looking at the reasons that we may see a bond market crisis this year, and will be published this week and the fourth will be looking at why the US Dollar may lose its status as the main reserve currency for the world, what that would likely look at and what other currencies and instruments might partly replace it. Everyone trading equities in this wild year should read these.
I have been a bit slow posting in recent days as I’ve been distracted setting up some paywalls at my substacks, but I’ll have a post out on Cryptos later today and the third post in my series above will be out in the next couple of days.
As I have been since the start of 2025 I’m still leaning on the bigger picture towards a weak first half of 2025 and new all time highs later in the year, very possibly as a topping process for a much more significant high. One way or another I think we’ll be seeing lower soon and I’m not expecting this to be a good year for US equities, not least because both of the last two years have been banner years for US equities. A third straight year of these kinds of gains looks like a big stretch. I could of course however be mistaken. UPDATE 11th March 2025 - I am wondering if this may be a bear market that dominates the whole of 2025.
If you like my analysis and would like to see more, please take a free subscription at my chartingthemarkets substack, where I publish these posts first. I also do a premarket video every day on equity indices, bonds, currencies, energies, precious commodities and other commodities at 8.45am EST. If you’d like to see those I post the links every morning on my twitter, and the videos are posted shortly afterwards on my Youtube channel.