


In a post on 17th April I posted some 15min charts with arrows showing an ideal path to forming bear flag wedges on SPX, QQQ and DIA. I added one for IWM in the post after that. I’ve updated these since but left the original arrows where I first drew them for reference on the last four charts today so you can see I wasn’t that far off so far.
In my last post on Tuesday I was saying that ideally we would see a modest decline (by recent standards) to play out some negative divergence on SPX, QQQ, ES and NQ and we saw that yesterday morning with all the hourly and 15min sell signals I mentioned in that post reaching target. After that I was looking for another and probably last leg up within those bear flags and since then we have seen new rally highs on all four.
So where are we up to now? Well on the economic side the first GDP numbers for Q1 came out negative as I suspected they would. Those may yet get revised to positive, but my personal assessment here is that the GDP numbers for Q2 2025 are likely to be significantly worse, and that as long as the Q1 2025 GDP stays red, then we are now 90% likely to see the two consecutive quarters of contraction to classify the first half of 2025 as a recession. Depending on policy in the meantime, it may well get worse from there in my view.
That being the case I am still leaning strongly towards likely bear flags forming here unless we start to see breaks back over the 200dmas on US equity indices. I’ll come to that but first ……..
I show the chart below every so often, but I look at it at least twice a week as it is very useful. It is the SPXADP daily chart and as you can see from the way I have done this chart that when it is getting close to +30 I look for a short term high, and when it is getting close to -25 I look for a short term low.
This is a good chart to watch to stay on the right side of the market and you can see that yesterday’s high was very close to +30. There is a high chance of seeing a short term high in the next few trading days.
SPXADP daily chart:

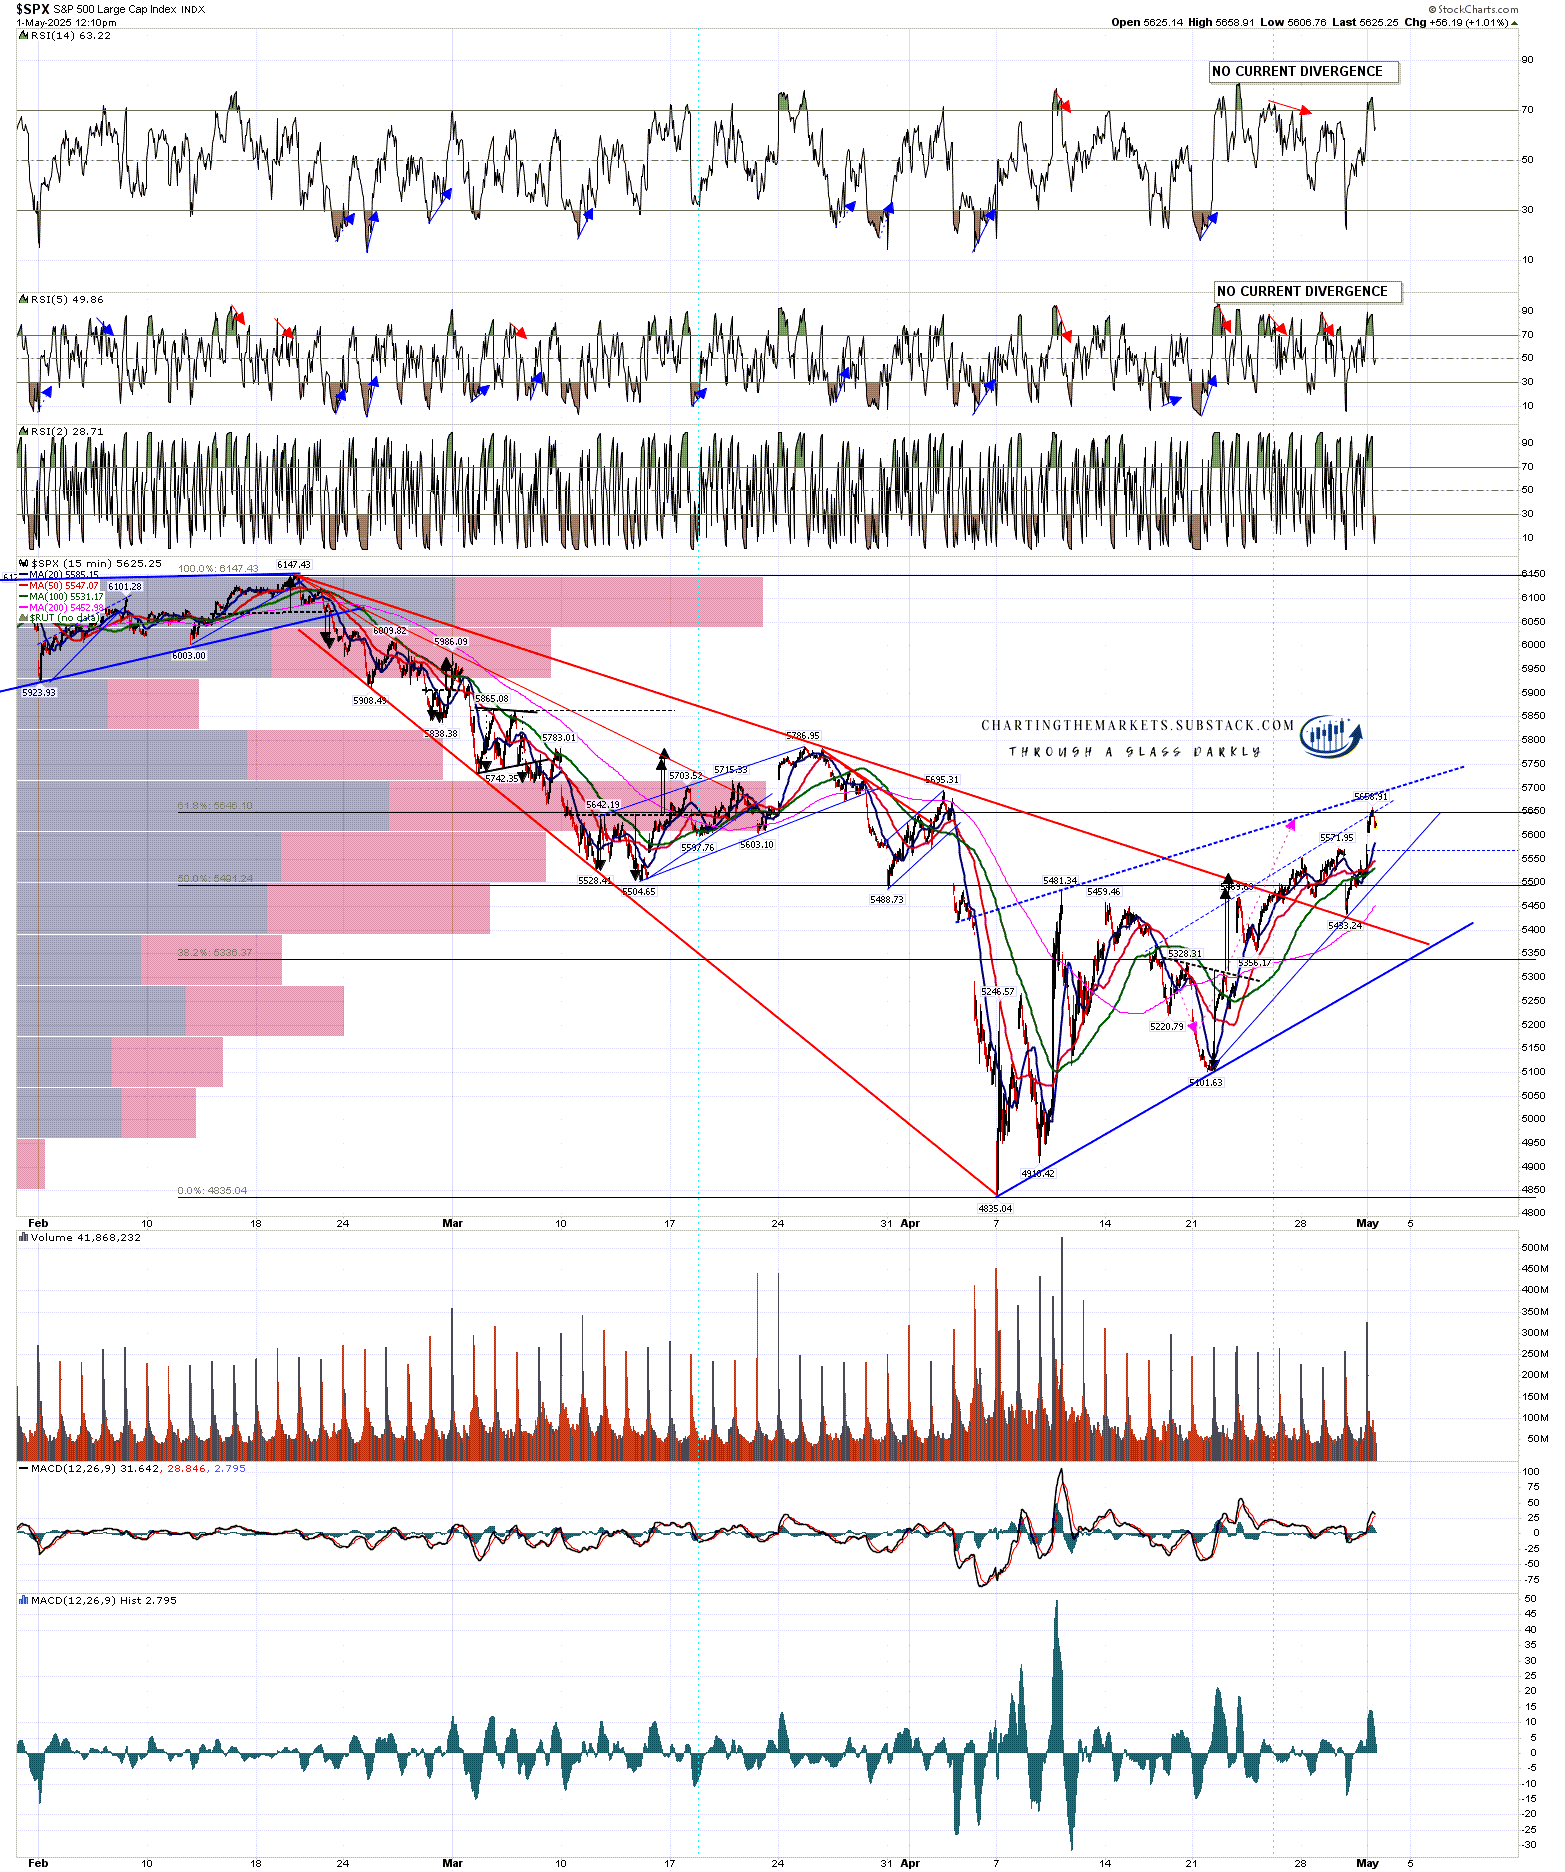
SPX gapped over the 50dma this morning and the only serious resistance level left is the 200dma, currently at 5746. As long as that stays resistance I’m leaning towards a sharp move down coming soon, likely retesting the April low at least. If the 200dma breaks hard then we may proceed directly to high retests instead but that’s very much a lower probability option in my view.
The same applies on QQQ as well in my view but that is a lot closer on the QQQ chart, with the 200dma currently in the 490 area. For reasons I will come to further down this may be the most important level to watch on the US indices.
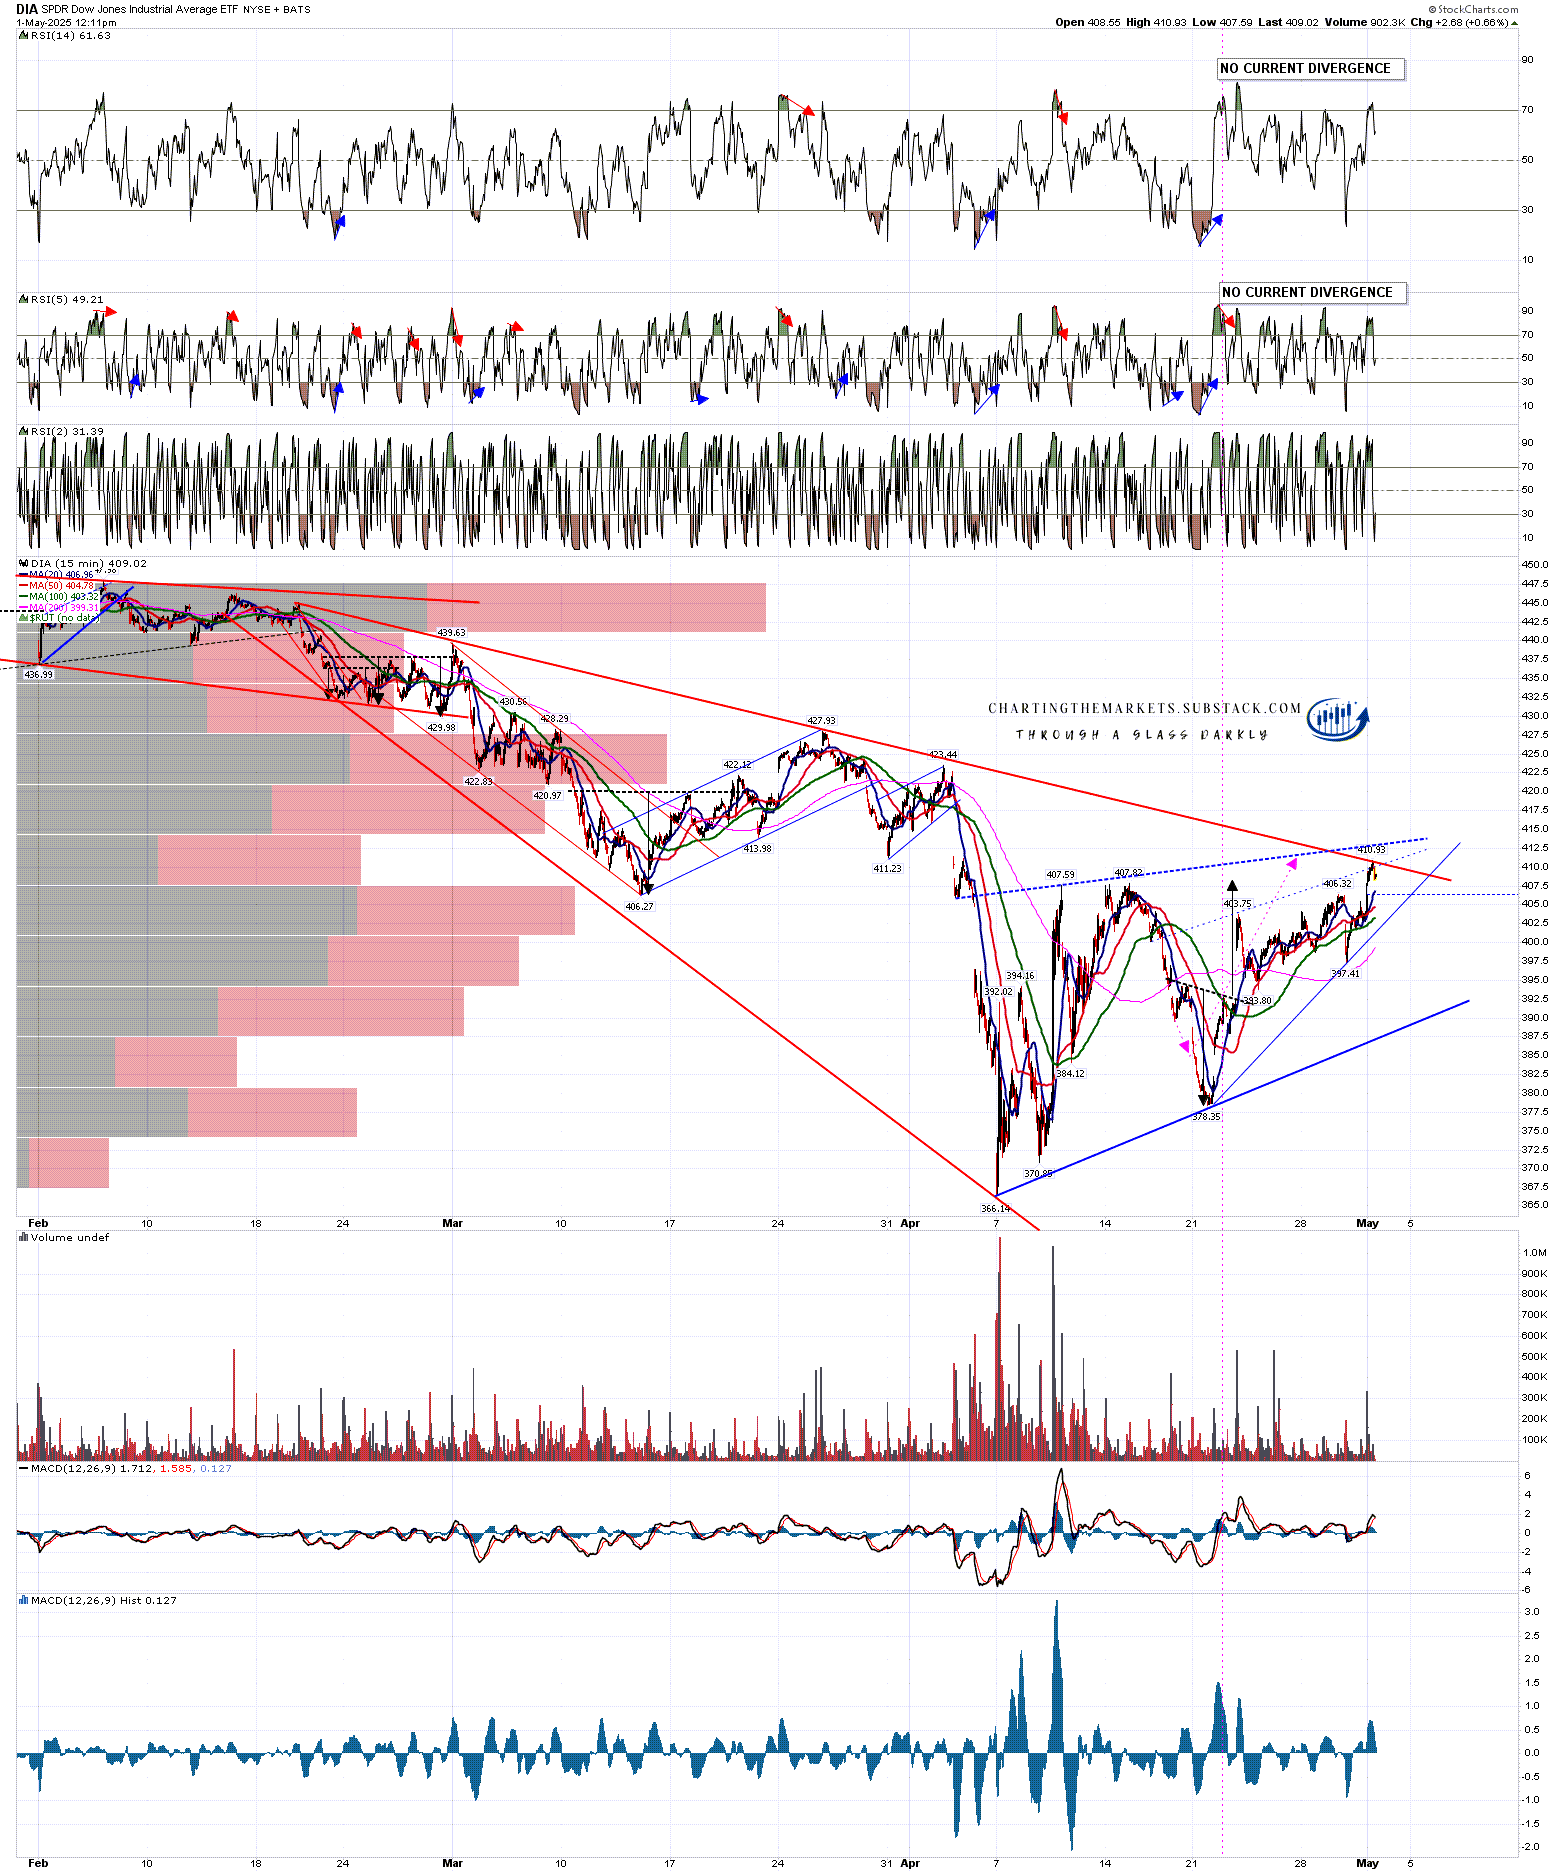
DIA is still below the 50dma at 413 and well below the 200dma at 419. I’d be concerned about any sustained break over the 50dma at this point.
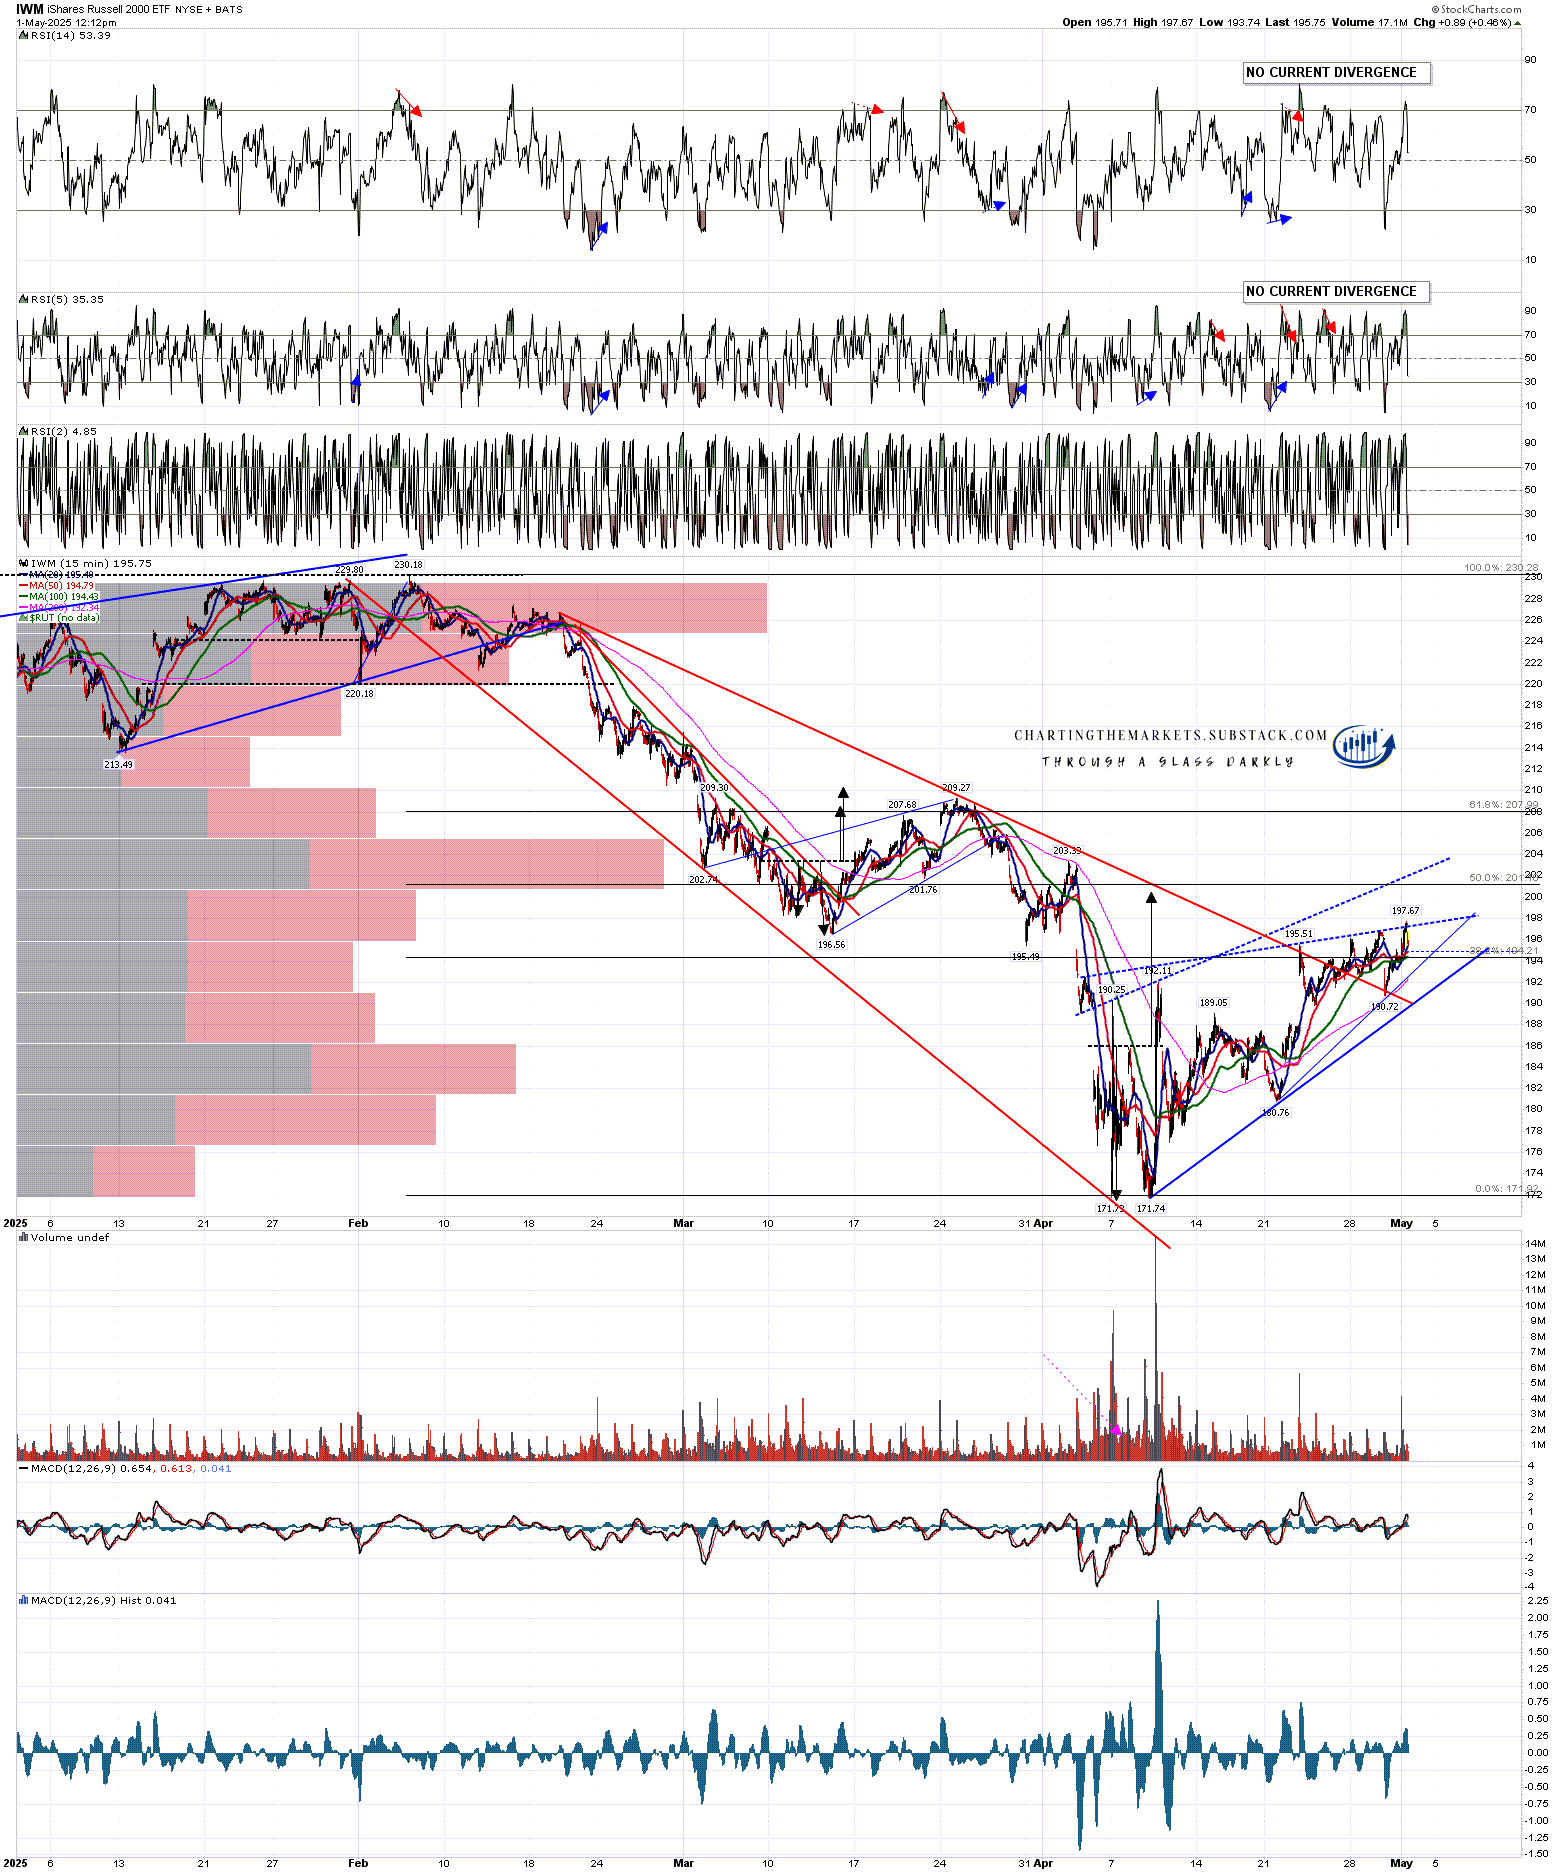
IWM is also still below the 50dma at 199 and I’m watching that as main resistance. The 200dma is still all the way up at 216 and looks unlikely to be tested until and unless we see all time high retests on at least SPX and QQQ.
SPX daily BBs chart:

In terms of the bear flags on the 15min charts SPX is now within striking range of the ideal bear flag resistance trendline I drew on 17th April, now in the 5695 area. That still very much looks like the obvious target.
SPX 15min chart:
QQQ has likely already hit the ideal bear flag wedge resistance trendline I drew. It may go a bit higher in a bearish overthrow but a strong break back over the 200dma at this point would likely kill the bear flag pattern.
QQQ 15min chart:

DIA is like SPX with the ideal resistance trendline I drew on 17th April in easy range, but with the current high at declining resistance from the highs. That is also a big level and could hold of course.
DIA 15min chart:
IWM is still well short of the ideal target trendline I drew but I drew a possible lower alternative last week that has been hit three times and is still holding. That too could hold.
IWM 15min chart:
On this overall setup I’m leaning towards one to three more days more upside with an ideal high at or slightly above the target trendline on SPX early next week. There is a significant and rising risk though that this rally could fail before that and, on this bear flag scenario, I don’t think this rally has more than six trading days left at the outside without at least a strong retracement. At the top of the last rally there were high quality bear flags and decent quality negative divergences to signal the high. I am hoping to see the same here but am a bit wary of a possible early fail.
I’m doing a series of (currently four) posts at the moment on my The Bigger Picture substack on the US Dollar, US Treasuries, and the reasons to be very concerned about the possible further sharp declines on both that may be coming this year. The first of these posts is looking at the potentially bearish setup on the US Dollar, the second is looking at the potentially very bearish setup on US Treasuries, the third is looking at the reasons that we may see a bond market crisis this year, and will be published this week and the fourth will be looking at why the US Dollar may lose its status as the main reserve currency for the world, what that would likely look at and what other currencies and instruments might partly replace it. Everyone trading equities in this wild year should read these.
As I have been since the start of 2025 I’m still leaning on the bigger picture towards a weak first half of 2025 and new all time highs later in the year, very possibly as a topping process for a much more significant high. One way or another I think we’ll be seeing lower soon and I’m not expecting this to be a good year for US equities, not least because both of the last two years have been banner years for US equities. A third straight year of these kinds of gains looks like a big stretch. I could of course however be mistaken. UPDATE 11th March 2025 - I am wondering if this may be a bear market that dominates the whole of 2025.
If you like my analysis and would like to see more, please take a free subscription at my chartingthemarkets substack, where I publish these posts first. I also do a premarket video every day on equity indices, bonds, currencies, energies, precious commodities and other commodities at 8.45am EST. If you’d like to see those I post the links every morning on my twitter, and the videos are posted shortly afterwards on my Youtube channel.